
Duy Hoa Dao
Content Marketing
Home > Insight > IT Business
From Data to Decisions: How Geospatial Data Visualization Impacts Your Business
5 minutes read
Audio description available
Updated on May 06, 2026
Nowadays, “digital” is thrown around as a buzzword, and data is vital to every business. But while collecting data is easier than ever, actually using it effectively is a different story. Raw data can be complex and challenging to interpret, with up to 80% of it containing geographic components. Using traditional charts and graphs can’t extract the full insights from the data. This is where geospatial data visualization comes in. It helps businesses to uncover hidden patterns and make smarter, more informed decisions.
Today’s leading enterprises are moving beyond static dashboards toward 4D Environments (3D space + time), allowing them to visualize historical patterns and future predictions in a single, unified interface.
1. Introduction to the Geospatial Data Visualization
1.1. What is Geospatial Data Visualization?
Data visualization is the graphical representation of information and data. Geospatial data visualization takes it further by turning location-based data (addresses, coordinates, sensor readings) into interactive maps, charts, and 3D models. This visually reveals trends, allowing businesses to:
- Understand spatial patterns: Identify customer clusters, traffic flows, and resource distribution.
- Gain actionable insights: Convert complex data into clear, actionable information for informed decision-making.
- Integrate with strategy: Utilize geospatial insights as a foundation for business operations.
- Combine with predictive analytics (AI, Machine Learning) for proactive forecasting of customer behavior, supply chains, and market shifts.
- This version focuses on the key benefits and applications of geospatial data visualization in a concise and impactful manner.
Examples of geospatial data visualization (numbers are random and for visualization purpose only)

Graphics and Visualizations (Tableau). Source: DataRoot Labs
1.2. Key Components of Geospatial Data Visualization
Geospatial data visualization transforms location-based data into powerful visual insights with geospatial data and mapping tools. Let's break down these components:
a) Geospatial Data: The "Where" of Your Information
This is the foundation – data that tells us where things are. It comes in various formats:
- Points: Representing specific locations like store branches, customer addresses, or points of interest.
- Lines: Depicting linear features like roads, rivers, or flight paths.
- Polygons: Defining areas like city boundaries, property parcels, or sales territories.
- Raster Data: Representing continuous data like elevation, temperature, or satellite imagery across a surface. Think of it like a photograph of the Earth. The units of raster data are pixels. Each pixel has a corresponding value. A grid of cells represents this data.
- Vector Data: the most common type of GIS data. Uses points, lines and polygons to represent real-world features. It’s more flexible than raster data.
Understanding the type of geospatial data you have is crucial for choosing the right visualization method.
Learn more about in this article: Vector and Raster Data In GIS Development Services
b) Mapping Software and Platforms: Bringing Your Data to Life
Visualizing geospatial data requires not only the data, but also the right tools. These tools range from specialized software for in-depth analysis to more accessible platforms for creating interactive maps and integrating location data into your applications. Let's explore the options:
- GIS Software: Geographic Information Systems (GIS) offer powerful capabilities for analyzing and visualizing complex geospatial data.
- Mapping Platforms: Services like Google Maps and Mapbox provide APIs and tools for creating interactive maps and integrating location data into your applications. These are often more accessible for non-GIS specialists.
With the right software and platforms in place, you can begin transforming your data into compelling visuals. Let's explore the different types of geospatial visualizations and how they can reveal hidden insights.
You might interest: Google Maps vs Mapbox - API Showdown
1.3. Different Types of Geospatial Visualizations
Geospatial data visualization offers a variety of tools to unlock the power of location. Different visualization techniques serve different purposes, from identifying hotspots and trends to revealing hidden relationships and patterns.
Here are some of the most common and effective types:
a) Choropleth Maps: Painting a Picture of Regional Differences
Choropleth maps use color shading to represent data values across different geographic areas. Think election results by state or sales figures by county. They're excellent for quickly comparing regions and identifying areas of high and low performance. Yet, they might hide differences within these places. For example, a county shaded dark blue for high average income might still contain pockets of poverty.
b) Heatmaps: Finding the Hotspots
This geospatial heatmap visualizes AirBnB rental rate hotspots in the New York City area. Tool: MongoDB
Heatmaps use color intensity to visualize the density or concentration of data points. Imagine a map showing crime hotspots in a city. Heatmaps are incredibly effective for identifying areas of high activity and are intuitively easy to understand. However, they can sometimes make it difficult to discern precise values at specific locations.
c) Point Maps: Pinpointing the Details
Tool: CARTO
Point maps are the simplest form of geospatial visualization, using dots or markers to represent individual data points. Think store locations, customer addresses. They're excellent for showing precise locations and overall distribution patterns. However, point maps can become cluttered with large datasets, making it difficult to distinguish individual points.
d) Bubble Maps: Showing Magnitude and Location
Source: our case study on: Drawing Application For Builders
Bubble maps combine the precision of point maps with the ability to represent data magnitude. The size of the bubble corresponds to the value of the data at that location. Imagine showing sales volume by city or market share by region. Bubble maps effectively communicate both location and magnitude but can become cluttered if too many bubbles overlap.
e) Flow Maps: Visualizing Movement and Connections
Flow maps show the movement and direction of data between locations, like trade routes, or traffic flow. They're excellent for visualizing dynamic processes and understanding connections between different areas. However, they can become complex when visualizing large amounts of data.
f) 3D Maps: Adding a New Dimension to Your Data
Source: our case study on Facilities - Accesses Management System
3D maps bring your data to life by adding height. This is super useful for things like designing cities, choosing the right spot for a building. While immersive, they can be computationally intensive and require specialized software.
Understanding these visualization types helps you select the right tool to deal with your problems and unlock location intelligence.
2. Geospatial Data Visualization: Key Benefits for Your Business
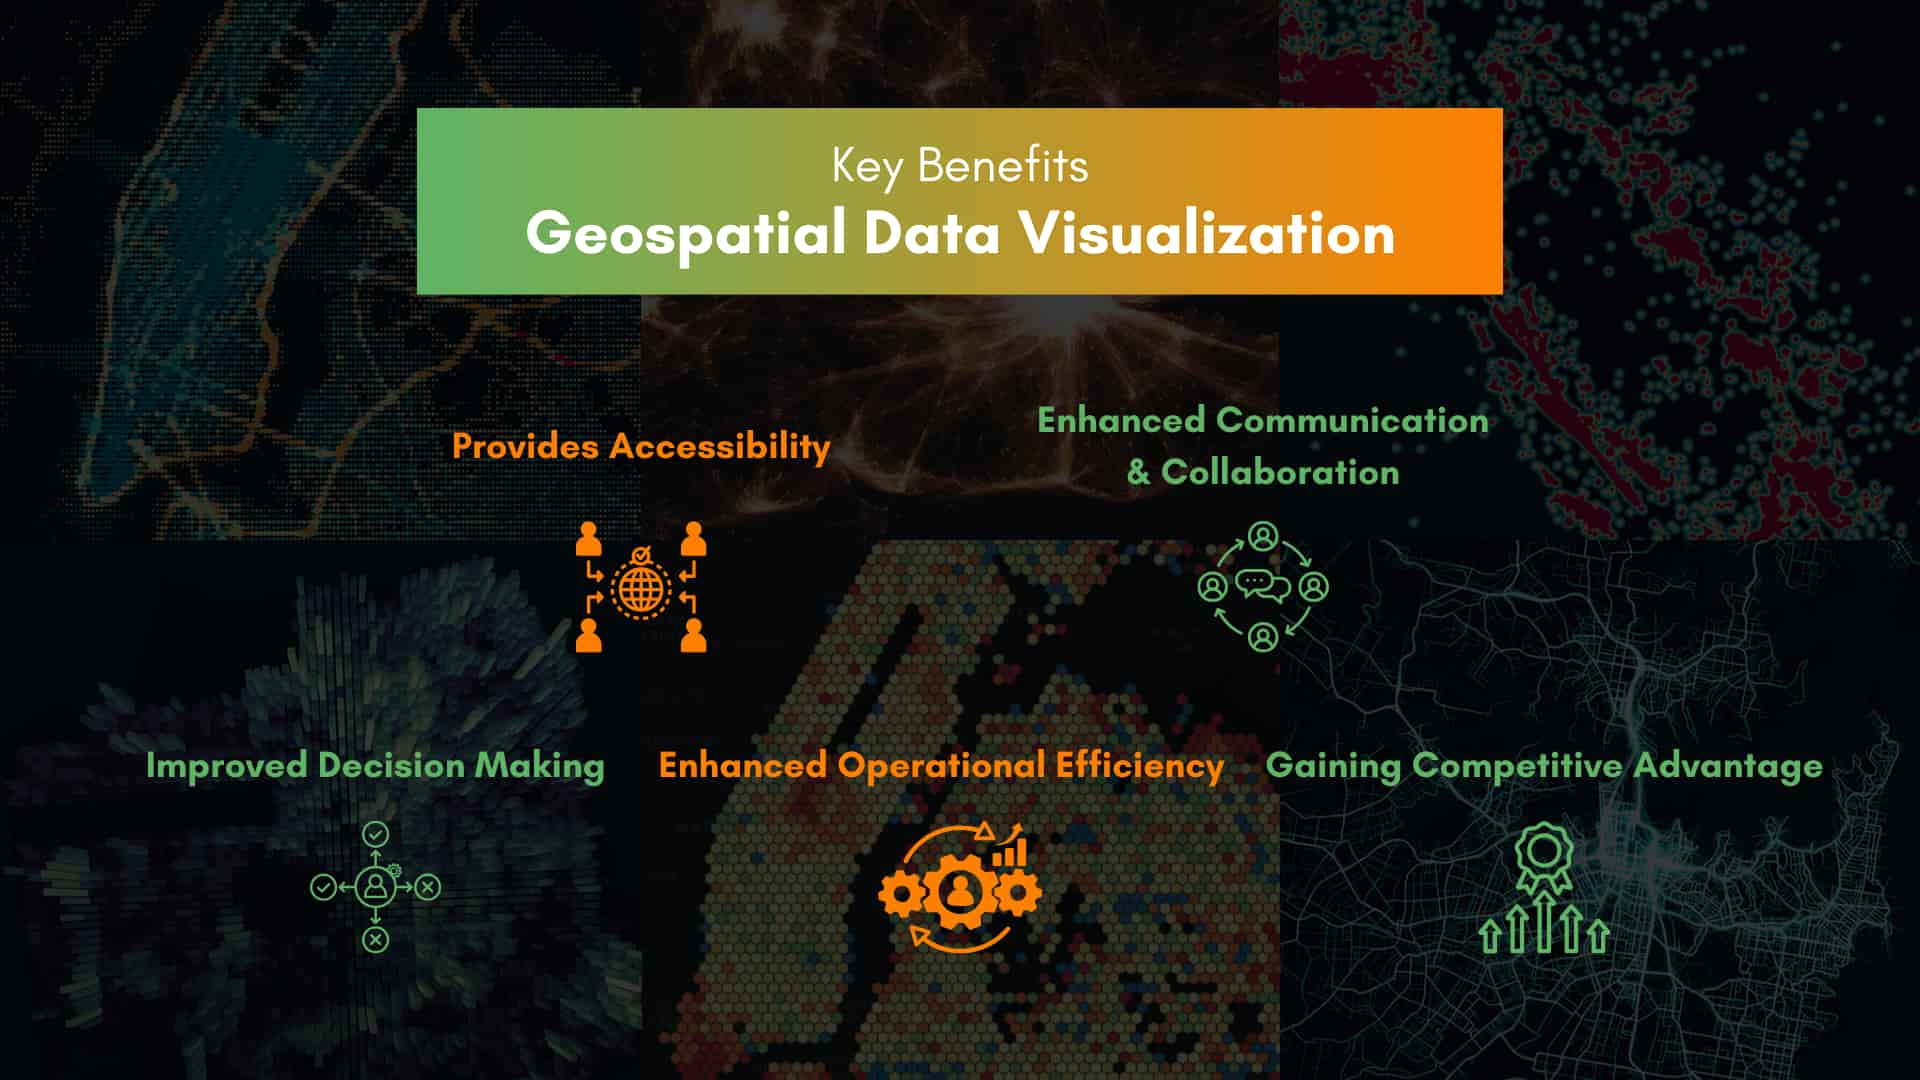
Visualizing spatial data provides a competitive moat that traditional spreadsheets cannot match:
Precision Decision-Making: Transform millions of data points into intuitive heat maps. Instead of analyzing sales rows, executives can see underperforming regions affected by specific local variables like infrastructure or demographics.
Operational Efficiency: For logistics and supply chains, GDV enables dynamic routing. By overlaying live traffic, weather, and port congestion data, companies can reduce fuel consumption by up to 20%.
Market Intelligence: Identify "white spaces" for expansion. Retailers use spatial visualization to map competitor locations against high-density customer zones to find the perfect site for their next branch.
Read more: Top 15 Outsourced IT Services Every Small Business Needs
3. Geospatial Data Visualization in Action: Real-World Examples
In many different areas, businesses are changing how they effectively analyze and leverage location-based insights. Here are a few examples that show how geospatial data is turning strategy into impact.
3.1. Real Estate: Uncovering Hidden Opportunities
Location is everything in real estate. Geospatial data visualization provides the tools to analyze property values, identify investment opportunities, and assess market trends with unprecedented clarity.
Geospatial data visualization empowers real estate professionals by:
- Identifying Investment Opportunities: Visualizing property values on a map instantly reveals areas with high growth potential or undervalued properties. This allows investors to quickly pinpoint promising opportunities.
- Conducting Comprehensive Market Analysis: Overlaying demographic data, crime statistics, and proximity to amenities provides a comprehensive view of each location's investment potential.
These capabilities translate to more informed investment decisions, maximized returns, and minimized risk.
- Relevant Visualization Types:
- Choropleth maps for property values and demographic data.
- Heatmaps for identifying high-demand areas.
- Point maps for visualizing available properties.
3.2. Logistics & Transportation: Streamlining Operations
Geospatial data visualization optimizes logistics by:
- Route optimization: Visualizing routes with real-time traffic data minimizes congestion, fuel consumption, and delivery times.
- Fleet management: Tracking vehicle performance metrics (speed, fuel consumption, idle time) by location identifies areas for improvement.
- Enhanced visibility: Real-time vehicle tracking improves security and enables proactive management.
You may be interested in: Optimize Your Fleet Management with Specialized Software
These benefits translate to increased efficiency, reduced costs, and improved delivery reliability.
- Relevant Visualization Types:
- Flow maps for visualizing delivery routes and traffic patterns.
- Point maps for tracking vehicle locations.
- Heatmaps for identifying areas of high activity or congestion.
- 3D maps for visualizing complex transportation networks.
3.3. Urban Planning: Smart Street Lighting Management through Visualization
Efficient city planning requires careful management of resources, and street lighting is a key factor. Geospatial data visualization helps optimize street lighting by:
- Creating a comprehensive inventory: Mapping the location and type of each light fixture provides a clear overview of the city's lighting assets.
- Improving maintenance: Identifying fixtures that need repair, or replacement prevents outages and reduces costs.
- Optimizing energy use: Overlaying lighting data with energy consumption data pinpoints areas where inefficient lighting is driving up costs, enabling targeted upgrades to more energy-efficient technologies.
Through efficient streetlight management enabled by geospatial visualization, cities can improve public safety, minimize light pollution, and create more sustainable urban environments.
- Relevant Visualization Types:
- Point maps for precise locations of lighting fixtures.
- Heatmaps for visualizing light pollution and identifying areas for improvement.
- Choropleth maps for displaying different lighting zones or regulations.
Now that you've seen the potential of geospatial data visualization, you might be wondering how to bring these insights to your own business. Let's explore some of the tools and technologies that make it possible.
4. Making Full Use of Geospatial Data: From Off-the-shelf Tools to Tailored Solutions
4.1. The Value of Standard Geospatial Tools
Start simple with user-friendly tools like ArcGIS Online, QGIS, and Kepler.gl. These platforms offer intuitive interfaces, templates, and resources for creating basic maps and exploring geographic patterns. These tools share some common characteristics:
- Map creation: They allow users to create various types of maps
- Data import: You can add data from many different types of files
- Basic analysis: They offer tools for basic spatial analysis (measuring distances, calculating areas)
- Sharing and collaboration: They provide options for sharing maps and collaborating
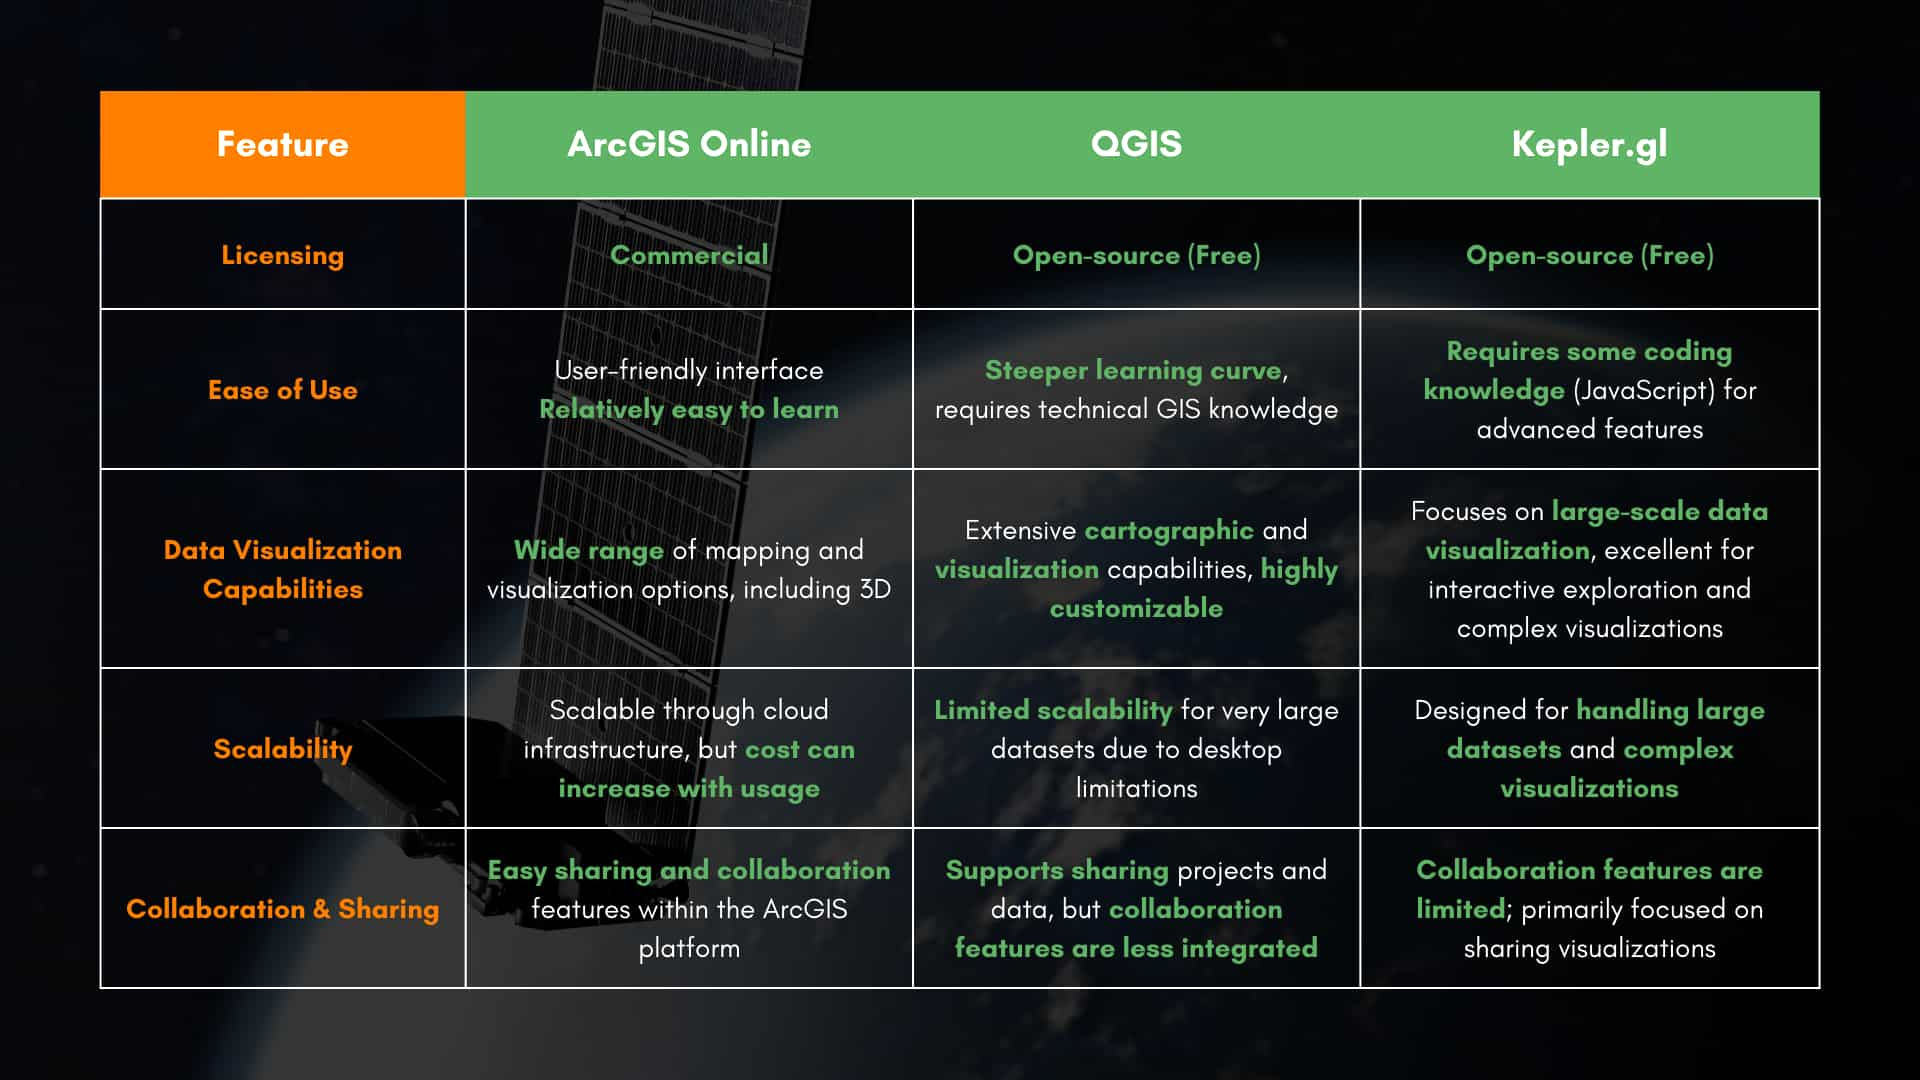
Different Tools Comparison
However, they also have drawbacks as data volumes grow. These tools may encounter difficulties such as limited features, expanding and combining with other systems.
These limitations highlight the need for custom-built solutions that can effectively manage and analyze complex geospatial data.
4.2. Exploring the Full Potential with Tailored Solutions
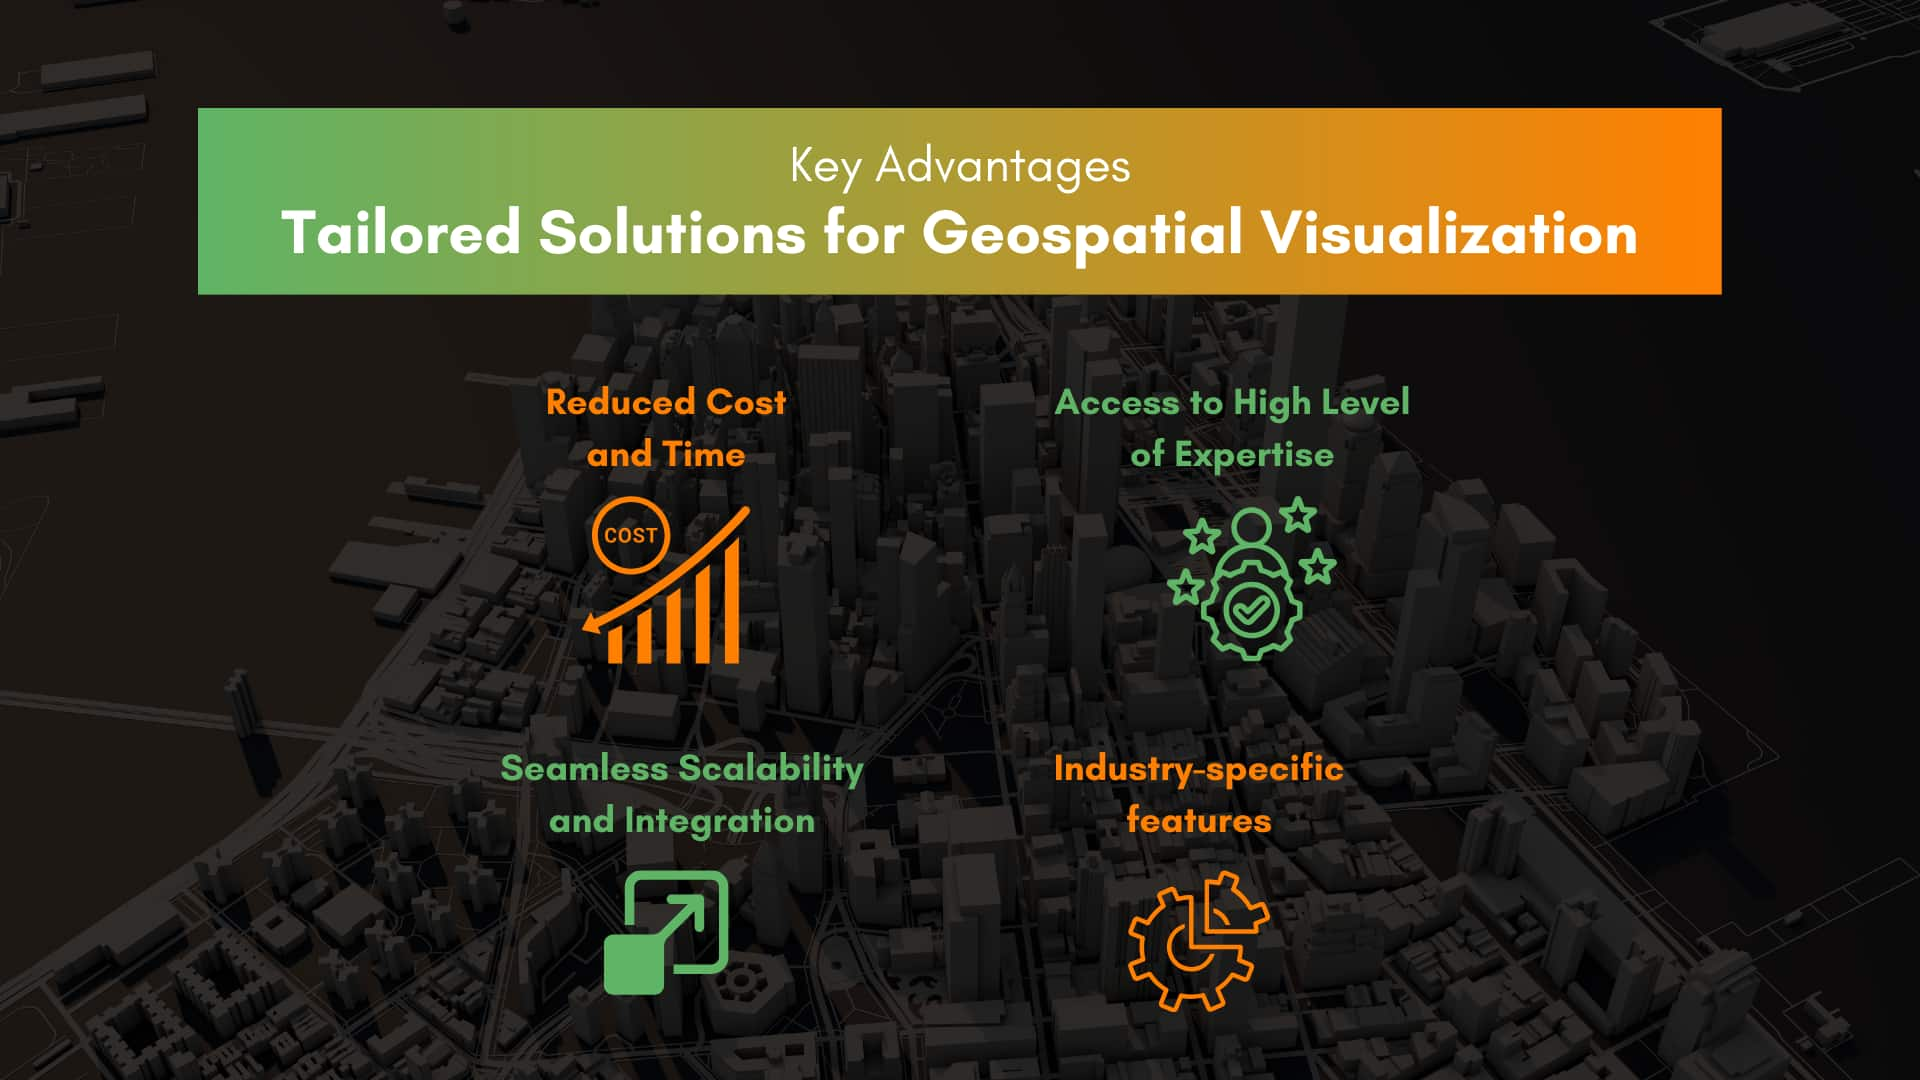
Custom-built geospatial solutions can help businesses fully leverage their data. As you outsource an IT partner, the solutions are built to your exact needs and specifications. Therefore, custom platforms can perfectly fit in and work smoothly with your current systems. Some of the advantages they offer:
- Reduced Cost and Time: Outsourcing eliminates the need for an in-house development team, freeing up valuable time and resources. This allows you to focus on your core business strategies and operations, leaving the technical stuff to the experts. This also leads to the next advantage.
- Access to High Level of Expertise. They can develop solutions optimized for your specific needs, incorporating advanced tech such as advanced spatial statistics, 3D modeling and visualization, cloud-based GIS platforms and services,... This can also mitigate risks during the development process.
Also read: What is 3D mapping and what is it used for - Seamless Scalability and Integration: Tailored solutions are designed for scalability, easily accommodating increasing data volumes and changing business requirements. Experts can also ensure seamless integration with your existing systems.
- Industry-specific features: Address unique challenges and opportunities in various sectors with specialized tools and functionalities. For example: advanced location analytics for retailers to optimize store placement, or real-time fleet tracking for logistics.
4.3. Real-World Examples: A Geospatial Solution for Smarter Lighting
Our expertise in GIS development has helped numerous businesses and government agencies transform urban planning. One example of our success is a project optimizing a light control management system.
Our client was a company that specializes in lighting system design and construction in Vietnam. After implementing our solution, they achieved higher efficiencies, substantial cost savings, and reduced energy consumption. By combining real-time data analysis with interactive geospatial dashboards and custom mapping tools, we delivered remarkable results for our client.
Read the full case study to learn more: Streamlining Light Control Management System.
5. The 2026 Tech Stack: AI, IoT, and Digital Twins
To stay ahead, your business must leverage the latest advancements in geospatial technology:
AI-Driven Spatial Intelligence: Machine learning algorithms now process satellite imagery and sensor data to predict trends, such as identifying potential supply chain bottlenecks before they occur.
Digital Twins: Create a virtual 1:1 replica of your physical assets—from a single warehouse to an entire city. This allows for "What-If" simulations, such as testing the impact of a flood on your distribution network.
Edge Computing & 5G/6G: Visualization is now instantaneous. With high-speed connectivity, data from IoT devices is processed at the "edge," providing real-time updates for field teams and autonomous delivery fleets.
6. Industry-Specific Impact & Use Cases
Real Estate & Construction: Architects and developers use BIM (Building Information Modeling) integrated with GIS to visualize how a new structure will interact with its environment, including shadow analysis and utility connectivity.
Retail & E-commerce: Hyper-local targeting allows brands to send personalized offers to customers’ mobile devices based on their exact proximity to a store.
Agriculture: Precision farming utilizes satellite imagery to map soil moisture and crop health, allowing farmers to apply water and fertilizer only where needed, significantly increasing yield and sustainability.
7. Challenges and Best Practices
Success in geospatial visualization requires navigating complex hurdles:
Data Privacy & Ethics: Ensure all location data is anonymized and complies with global regulations like GDPR and CCPA.
Data Accuracy: "Dirty data" leads to "wrong locations." Investing in high-quality data cleaning and validation is non-negotiable.
Interoperability: Ensure your visualization tools integrate seamlessly with your existing ERP (Enterprise Resource Planning) and CRM systems for a single source of truth.
Conclusion
In today's data-driven world, geospatial data visualization is essential. It gives businesses the crucial insights they need to make smart decisions, improve how they operate, and stay ahead of the competition. By using location data effectively, businesses can discover hidden opportunities and achieve sustainable growth.
Want to start applying geospatial data visualization from today? Checkout BHSoft’s GIS Solutions and unlock a comprehensive perspective of your location data.
We can help you achieve:
- A comprehensive visual representation of geospatial information with map making and geographic display
- Optimized operations with system routing and navigation to streamline your operation
- Custom built GIS Development, with both fundamental and specific features for your business. Furthermore, seamlessly integrate GIS software with robust databases and collaborate with leading services such as Google Maps, Mapbox, OpenLayers.
If you need help, contact us today and let's discuss how our GIS solutions can improve your business’s operations.