Smart Environmental Monitoring: How IoT, GIS, and Automated Alerts Work Together
15 minutes read
October 26, 2026
Environmental challenges are becoming increasingly complex for cities, industrial parks, and urban developments.
Air pollution, noise, water quality, and flood risks affect public health, infrastructure, and daily operations. Yet environmental monitoring still frequently depends on disconnected sensors, periodic inspections, and separate reporting systems.
The challenge is not simply collecting more environmental data. It is turning that data into reliable information that helps organizations identify problems and respond appropriately.
Smart environmental monitoring combines Internet of Things (IoT) sensors, Geographic Information Systems (GIS), data processing, and automated alerts to provide a connected view of environmental conditions.
This approach enables operators to monitor selected parameters, identify unusual measurements, visualize affected locations, and coordinate investigations.
What Is Smart Environmental Monitoring?
Smart environmental monitoring is the use of connected sensing devices, communication networks, and digital platforms to collect, analyze, and visualize environmental information.
A typical platform can monitor:
- Air quality: PM2.5, PM10, and selected gaseous pollutants
- Water conditions: Water level, temperature, pH, or turbidity
- Noise: Sound levels in monitored locations
- Weather: Temperature, humidity, rainfall, and wind
- Flood risk indicators: Water-level changes and other relevant observations
The exact parameters depend on the operational environment and monitoring purpose.
For example, a city may focus on pollution hotspots and flood-prone areas, while an industrial park may prioritize boundary monitoring, water conditions, and environmental reporting.
How Does an IoT Environmental Monitoring System Work?
A connected monitoring solution typically has five operational stages.
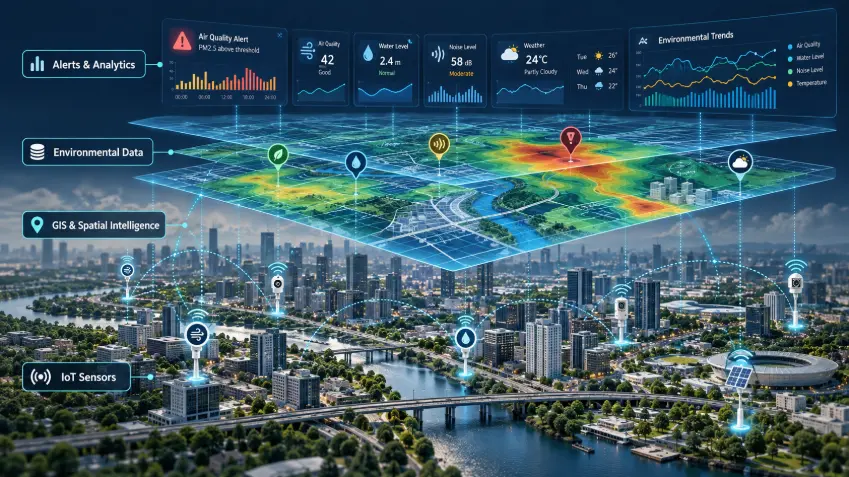
1. Environmental Sensors Collect Measurements
Sensors installed at selected locations capture readings according to a defined sampling schedule.
Each measurement should be associated with a device identity, timestamp, unit, and location.
Device selection should consider environmental conditions, durability, expected accuracy, and maintenance requirements.
2. Connectivity Delivers Data to the Platform
Devices send measurements through suitable communication networks.
Depending on deployment requirements, these may include cellular networks, Wi-Fi, Ethernet, or low-power IoT connectivity.
Gateways may aggregate readings before forwarding them to backend services.
3. Data Processing Validates Readings
The platform checks incoming measurements for problems such as missing timestamps, implausible values, unexpected changes, or malfunctioning devices.
These checks are important because a sensor error can otherwise trigger a misleading pollution alert.
Validation may include automated rules and periodic human review.
4. GIS Visualizes Geographic Conditions
GIS associates measurements with their physical locations.
Operators can use interactive maps to identify monitoring stations, explore readings, compare areas, and examine historical patterns.
For instance, a GIS dashboard might highlight stations reporting unusually high particulate matter levels.
However, measurements from individual stations should not automatically be interpreted as accurate conditions across an entire neighborhood without suitable spatial analysis.
5. Automated Alerts Support Operational Response
When validated measurements meet configured alert criteria, the platform can notify authorized personnel.
An alert workflow may include detecting an event, checking its reliability, displaying the location, assigning responsibility, and recording the outcome.
The objective is to connect environmental observations with a structured operational response.
Example: From a Pollution Reading to an Actionable Alert
Consider a hypothetical urban environmental monitoring network.
A monitoring station reports an unusual increase in PM2.5.
First, the system checks the reading against the station's recent history and relevant data-quality rules.
If the condition meets the configured criteria, the platform creates an alert.
A GIS dashboard highlights the sensor's location and provides associated measurements.
An environmental operator reviews the event, checks nearby observations, and determines whether further investigation is required.
If necessary, the team coordinates field verification or follows an approved response procedure.
The alert is then documented, creating a record for subsequent analysis.
This example shows how environmental monitoring becomes more valuable when measurements are connected to location, verification, and response workflows.
Why Is GIS Important for Environmental Monitoring?
Environmental conditions are inherently geographic.
GIS helps operators answer questions that are difficult to address using disconnected tables.
Where Are Unusual Conditions Being Detected?
Map-based monitoring can identify stations and locations reporting specific environmental events.
Which Areas May Require Investigation?
GIS supports spatial comparisons involving monitoring locations, infrastructure, and other geographic information.
How Have Conditions Changed Over Time?
Time-enabled maps and charts can help analysts explore historical trends.
Which Infrastructure Assets Are Nearby?
Environmental information can be combined with drainage networks, facilities, roads, or other relevant assets.
GIS therefore turns measurements into geographically contextualized information.
What Are the Benefits of Automated Environmental Alerts?
Automated alerts can reduce dependence on manual dashboard checking.
Potential benefits include faster event awareness, more consistent alert records, clearer responsibility assignments, and better operational coordination.
However, a well-designed alert system must balance sensitivity with reliability.
Excessive false alerts can create alert fatigue, while poorly selected thresholds may fail to identify meaningful conditions.
Organizations should document their alert rules, validation processes, escalation procedures, and responsible personnel.
Smart Environmental Monitoring Use Cases
Urban Air Quality Monitoring
Cities can monitor selected pollution indicators across an installed sensor network.
GIS dashboards help operators inspect station conditions and historical changes.
Flood and Water-Level Monitoring
Sensors located near drainage infrastructure or waterways can help detect unusual water-level increases.
Alerts may support timely investigation alongside other hydrological information and official warning systems.
Industrial Park Monitoring
Industrial park operators may use distributed monitoring stations to track environmental conditions and maintain operational records.
Noise Monitoring
Noise sensors can help identify periods or locations requiring further assessment.
Environmental Reporting
Data platforms can consolidate measurements into dashboards, historical summaries, and reports.
Reporting outputs should be designed according to applicable standards and the intended decision-making purpose.
Common Implementation Challenges
Sensor Accuracy and Calibration
Low-cost or distributed sensors can be affected by environmental conditions, equipment drift, and installation quality.
The US Environmental Protection Agency emphasizes quality assurance, routine maintenance, and data review when using air sensor networks.
Data Completeness
Connectivity interruptions and device failures can result in missing information.
Platforms should distinguish missing data from actual zero readings.
Alert Reliability
Thresholds should be based on the relevant monitoring objective, technical requirements, and applicable regulatory framework.
Data Integration
Different devices may provide measurements in different units or formats.
A unified platform must handle these differences consistently.
Operational Ownership
Organizations need procedures defining who maintains sensors, validates measurements, reviews alerts, and approves responses.
How to Implement a Smart Environmental Monitoring Platform
Step 1: Define the monitoring objective. Identify environmental questions the organization needs to answer.
Step 2: Select monitoring locations and devices. Consider geographic coverage, installation conditions, and measurement requirements.
Step 3: Establish data-quality procedures. Define calibration, validation, maintenance, and monitoring responsibilities.
Step 4: Design IoT integration. Connect devices to a secure data ingestion and storage infrastructure.
Step 5: Build the GIS dashboard. Present monitoring locations, readings, trends, and relevant geographic context.
Step 6: Configure alert workflows. Define detection criteria, verification requirements, notifications, and escalation procedures.
Step 7: Validate through a pilot. Evaluate data completeness, measurement reliability, alert performance, and operational usability before scaling.
How BHSoft Supports Smart Environmental Monitoring
BHSoft's Smart City platform includes an environmental monitoring module covering particulate matter, air, water, and noise observations, together with IoT-based data collection, localized pollution and flood alerts, analytics, and sustainability reporting.
The module fits within a wider Smart City architecture combining IoT, GIS, AI, data processing, Cloud/Edge technologies, and an Intelligent Operations Center.
This integrated approach is relevant for cities, industrial parks, and urban developments seeking coordinated monitoring rather than disconnected sensor dashboards.
Frequently Asked Questions
What is IoT environmental monitoring?
IoT environmental monitoring uses connected sensors and software to collect, transmit, and analyze environmental measurements such as air pollution, water conditions, and noise levels.
How does GIS improve environmental monitoring?
GIS connects environmental measurements with geographic locations, enabling map-based visualization, spatial comparisons, and location-specific investigation.
Can environmental monitoring systems send automatic alerts?
Yes. Systems can generate alerts when validated readings meet predefined conditions. Alert design should account for data quality and the appropriate response process.
Does smart environmental monitoring require AI?
No. Sensor monitoring and rule-based alerts can operate without AI. Machine learning may support additional analysis, but it is not a prerequisite.
Can environmental IoT sensors replace official regulatory monitoring stations?
Not automatically. Whether measurements are suitable for regulatory use depends on sensor performance, quality assurance, monitoring methods, and applicable legal requirements.
Conclusion
Smart environmental monitoring enables organizations to move from isolated measurements toward coordinated environmental awareness.
IoT sensors collect observations. Data processing improves their reliability. GIS provides geographic context. Automated alerts help teams identify and investigate unusual conditions.
The result is a more connected approach to environmental operations, provided the data and workflows are properly designed.
Explore Smart Environmental Monitoring with BHSoft
BHSoft's Smart City solution brings together environmental monitoring, GIS, IoT connectivity, and operational dashboards within a modular platform.
Explore the BHSoft Smart City solution: https://bhsoft.vn/smartcity
Connect with BHSoft to discuss your IoT development requirements, Edge AI integration opportunities, and scalable software architecture.