Equal Earth: Why Map Projection Still Matters in Modern GIS Engineering
10 minutes read
September 21, 2026
A map is never simply data displayed on a screen.
Every map makes choices about how the surface of the Earth is represented. Those choices affect what users see, what they compare, and sometimes even the conclusions they draw from the visualization.
That is why the Equal Earth projection is worth understanding, not because it should replace every other projection, but because it is a good example of an important principle in GIS:
Different spatial problems require different ways of representing the world.
Introduced in 2018 by Bojan Šavrič, Tom Patterson, and Bernhard Jenny, Equal Earth is a pseudocylindrical equal-area world map projection. It was designed to preserve the relative area of geographic regions while maintaining a visually balanced world-map shape inspired by the familiar Robinson projection.
That makes it fundamentally different from Mercator.
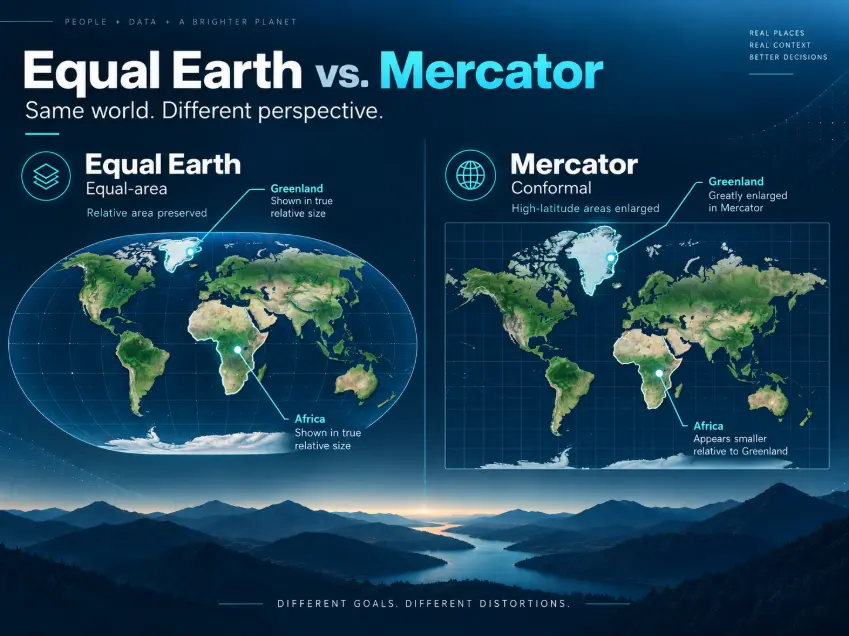
Mercator is a conformal projection. It preserves local angles and is therefore valuable in applications where direction and local geometric shape matter. But area distortion increases significantly toward the poles. Equal Earth makes the opposite priority: it preserves relative area while accepting distortion in shape.
Neither projection eliminates distortion. They optimize for different things.
And for GIS engineering teams, that distinction matters far beyond cartography.
Equal Earth vs. Mercator: different goals, different distortions
Representing a spherical or ellipsoidal Earth on a flat surface always introduces distortion.
The engineering question is therefore not: Which projection is correct?
It is: Which properties should remain meaningful for the problem we are solving?
Mercator and Equal Earth provide a useful example:
- Mercator preserves angles locally, but regions at high latitudes appear disproportionately large.
- Equal Earth preserves area. Geographic regions are therefore shown in proportions that correspond much more closely to their actual relative areas.
This difference becomes especially noticeable when comparing regions such as Africa and Greenland. On a Mercator map, Greenland can visually appear comparable in size to Africa, even though Africa is vastly larger in actual land area. Equal-area projections avoid this type of area distortion, although they introduce other distortions in shape.
This makes Equal Earth particularly relevant when area itself contributes to how the visualization is interpreted.
For example:
- climate and environmental analysis
- land-use visualization
- agriculture and forestry
- biodiversity
- disaster exposure
- population or demographic mapping
- global resource distribution
- environmental risk
- global thematic dashboards
In these situations, displaying geographic areas with strongly distorted relative sizes can influence how users visually interpret the data. An equal-area projection can therefore be a more appropriate analytical representation.
But that does not make Equal Earth a universally better map.
The creators themselves have emphasized that it should not automatically become the default for every world map. Equal-area projections solve one class of distortion while introducing others.
That is the more important lesson.
The real question is not “Equal Earth or Mercator?”
For a GIS team, the more useful question is: What does the user need to understand or decide?
Only after answering that should we decide how the geographic information should be represented.
Consider several common GIS scenarios.
🌎 Global thematic analysis
A dashboard showing climate risk, land coverage, agriculture, biodiversity, emissions, or environmental exposure may benefit from an equal-area projection.
In this type of application, the user is often comparing patterns across large geographic regions. Relative area therefore matters.
Equal Earth can be a strong candidate because it maintains equal area while retaining a visually balanced world-map appearance.
🗺️ Operational 2D GIS
The requirements are very different for applications such as:
- road and transportation networks
- utility asset management
- field inspections
- construction monitoring
- cadastral systems
- infrastructure operations
- local navigation
Here the user may care more about accurate local interaction, familiar map behavior, integration with existing tile infrastructure, or measurements within a specific coordinate reference system.
Equal Earth may offer little benefit. A local projected CRS, Web Mercator, or another coordinate system may be much more appropriate.
🌐 3D GIS and Digital Twins
Some spatial problems are not best represented through a flat map at all.
Urban planning, infrastructure visualization, terrain analysis, BIM integration, city-scale systems, and Digital Twins often require understanding objects in a three-dimensional context.
In those situations, elevation, volume, line of sight, building geometry, terrain, and spatial relationships may be more important than the choice of a global 2D projection.
The representation changes because the question changes.
None of these approaches replaces the others. They serve different purposes.
A mature GIS solution should therefore not begin with: “Which map technology should we use?”
It should begin with: “What does the user need to understand or decide?”
Then we can ask:
- What scale are we working at?
- Which spatial properties matter?
- What measurements must remain meaningful?
- What interaction does the user need?
- And which representation communicates that information most effectively?
From map projection to GIS product architecture
For a GIS development team, supporting another projection is not necessarily as simple as changing one configuration parameter.
Depending on the architecture and technology stack, projection choice may affect many parts of the visualization pipeline.
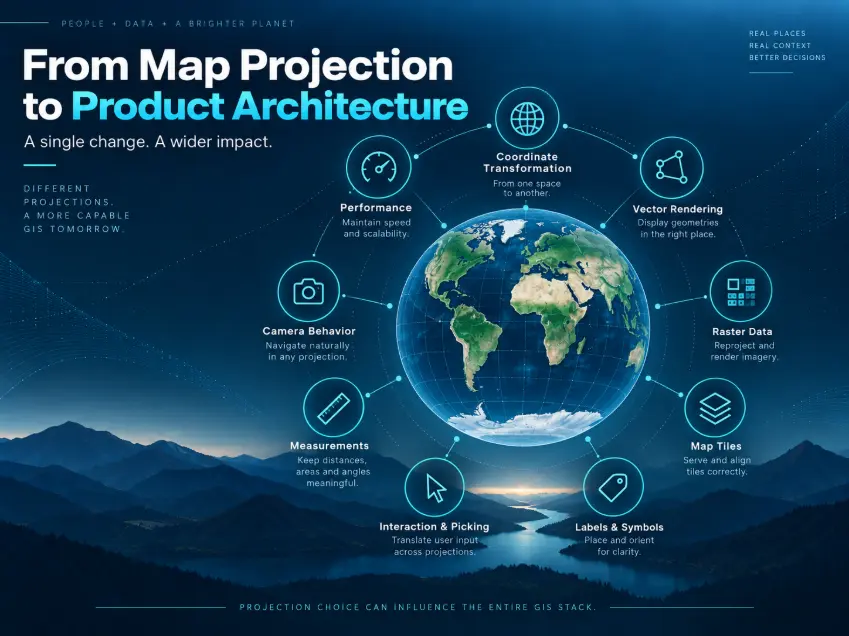
For example:
Coordinate transformation
Source datasets may use WGS84, Web Mercator, national coordinate systems, engineering coordinate systems, or other CRSs.
The application must determine where transformations occur: database → GIS service → tile pipeline → frontend → renderer
Those transformations also need to remain numerically reliable.
Vector rendering
Roads, administrative boundaries, polygons, points, and other vector features must be transformed and rendered correctly in the selected projection.
This can influence:
- geometry processing
- clipping
- simplification
- tessellation
- styling
- rendering performance
Raster data
Satellite imagery, terrain-derived products, heatmaps, or environmental raster datasets may need reprojection or resampling.
That raises additional questions around:
- resolution
- interpolation
- image quality
- caching
- preprocessing
- runtime performance
Map tiles
Many existing web mapping systems assume a Web Mercator tile pyramid. Introducing another projection can affect how map tiles are generated, addressed, cached, and displayed.
Some modern mapping platforms already support Equal Earth directly, while other architectures may require transformed vector tiles, raster reprojection, or a custom rendering strategy. Equal Earth is supported in major GIS software ecosystems, including Esri tooling and Mapbox projection support.
Labels and symbols
Text labels, icons, and symbols also need to remain readable and correctly positioned after transformation.
A projection that works well geometrically can still create usability problems if label placement and collision behavior are not considered.
Interaction and picking
GIS applications are rarely passive maps. Users click features, inspect objects, draw polygons, select areas, query attributes, measure distances, and edit spatial data.
Changing the representation means verifying that:
- screen coordinates map correctly to geographic coordinates
- selections return the correct feature
- drawing tools behave as expected
- overlays remain aligned
- coordinate readouts remain meaningful
Measurements and spatial calculations
One of the most important engineering considerations is separating visual representation from analytical calculation.
A map may be displayed in one projection while measurements and spatial operations are performed using another coordinate system or geodesic calculation.
Distance, area, buffering, intersection, routing, and other operations must therefore be evaluated independently from what is displayed on screen.
Projection choice should not silently change analytical meaning.
Camera and navigation behavior
A flat Mercator map, an Equal Earth world map, and a 3D globe produce very different navigation experiences.
Zooming, panning, world wrapping, extent limits, camera transitions, and scale behavior may all need to be reconsidered.
Performance
Reprojection can occur:
- before data reaches the client
- during tile generation
- on a GIS server
- in the browser
- or inside the rendering engine
Each approach has different implications for latency, memory, bandwidth, GPU workload, and scalability.
The correct implementation therefore depends not only on cartographic requirements but also on the product architecture.
Explore More from BHSoft
3D City Visualization with Cesium
How BHSoft Created a Digital Twin with CesiumJS
Urban Planning with GIS: From Data to Smarter Decisions
3D GIS & Digital Twin Solutions
Need a GIS solution built around the right spatial representation?
Whether your project requires global thematic mapping, interactive 2D GIS, 3D geospatial visualization, or a more specialized projection, the technology should follow the problem, not the other way around.
At BHSOFT, we help businesses design and develop GIS solutions that combine spatial data, modern visualization technologies, and flexible software architecture.
Have a GIS or mapping challenge in mind? Talk to our team about the right approach for your project.